Identifying Web Performance bottlenecks
Jan 15, 2016 · 5 minute read · Commentsenglishweb performance
This text came about after a friend sent me a email asking if I know of a good article in Brazilian Portuguese on how to identify Web Performance bottlenecks. Unfortunately, I didn’t remember any, so then I wrote some points to get him started.
Web Performance is a vast and deep subject. If you have references, corrections or even tips, please feel free to comment here or send me a email.
Backend/Front-End
When it comes to the internet world, backend is everything that is processed by the site (web servers, databases, APIs, etc.). Front-end is everything that is processed by web browsers. This is relatively easy to identify; most site monitoring services (Syntethic monitor) use the TTFB (Time to First Byte) as part of their measurement metrics. A high value in TTFB can happen when the backend delays in delivering HTTP responses. E.g.: Dynamic pages with heavy data processing.
When internet world, backend is everything process for site (web servers, databases, APIs, etc.). Front-end is everything that process by web browsers. This is relatively easy to identify, the most site monitoring services (Syntethic monitor) use the TTFB (Time to First Byte) as part of their measurement metrics. A high value in TTFB can happen when the backend is delaying to delivery HTTP responses. E.g.: Dynamic pages with heavy data processing.
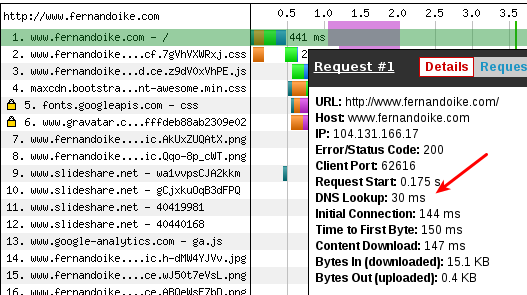
The high value of TTFB can occur when your monitoring test is far away from your site. A simple example is my site, when it was tested both in the USA and Sao Paulo.
Webpagetest - TTFB
| Country | Time |
|---|---|
| EUA | 0,121s |
| Brasil | 0,325s |
This’s a real problem for brazilian user sites hosted in USA provides. The network latency at least 100 milliseconds, some companies prefer to clone a part of their servers architecture in Brazil to decrease the latency. So, considering latency, a good value to TTFB for Brazilian sites hosted in USA is 300 milliseconds, if the sites and users are the same region or country, the good value is +- 130 milliseconds.
the high TTFB
TTFB is a really good metric to indicate that some problem in backend, it’s a trigger to start a research to identify bottlenecks such as servers overloads, misconfiguration, slow responses of third-party APIs, bad choose of architecture definition, etc.
SSL/TLS
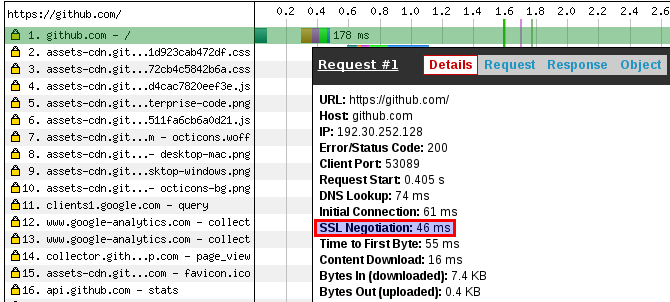
It’s common sense that’s good idea to provide cryptography for users sites, but few people really important to implement SSL/TLS and less yet to provide good performance when sites are using cryptography. It seems a minor stuff but it didn’t, I saw sites just to complete TLS handshake takes almost 1 second. A good value to SSL handshake is under 100 milliseconds.
TLS/SSL do Github
TLS/SSL das listas do PostgreSQL Brasil
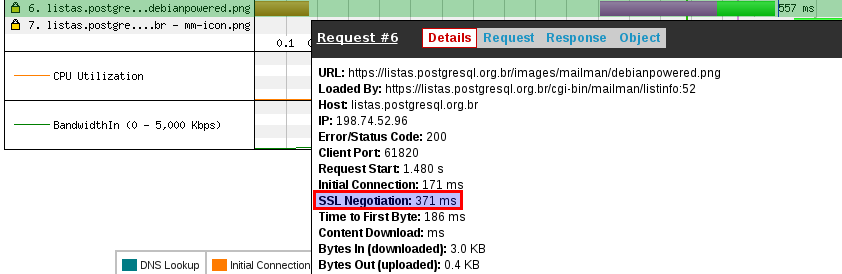
I did comparative test SSL handshake of Github homepage and mail list homepage of PostgreSQL Brasil. It’s really impressive as a good infrastructure and tweak TLS configuration can provide a good performance. Obliviously, Github was better than PostgreSQL Brasil (my fault), at last they have a lot of money. :)
DNS
Probably, DNS server is the most important network service that pay less attention. Nevertheless, it’s important to think if DNS is being a bottleneck. It’s good performance when browsers resolve DNS less 70 milliseconds. For sites with users around the world, consider use a DNS service with servers locate in more regions or countries.
Others
TTFB can be anything, then, think about to use a FLOSS Monitoring software or even to pay someone. Really important, you need to plan what you will monitor and what metrics you will use, or you don’t want to dive in the data deep-sea without any way to rescue.
When Monitoring Service has a good implementation, it can show where are bottlenecks and many other views how your system or sites are good health.
Front-End
Even though that root case is the site infrastructure, somethings are just Identifying to analyze a web browser. Because, browsers allow whole context to open a web page and still haven’t a software that simulate exactly the browser behavior (Phamthonjs is almost there).
Compressão (gzip)
Any web server HTTP response is text/plain type, they have to be compression by gzip (RFC 2616). If you want further about this subject, read my post “CDN ranking and gzip compression (only portuguese)”. But, if you don’t time to learn portuguse or wait me write in English, below a brief note.
If Content-Type HTTP header contains any value below, consider enable compression in your web server.1
- text/html
- application/x-javascript
- text/css
- application/javascript
- text/javascript
- text/plain
- text/xml
- application/json
- application/vnd.ms-fontobject
- application/x-font-opentype
- application/x-font-truetype
- application/x-font-ttf
- application/xml
- font/eot
- font/opentype
- font/otf
- image/svg+xml
- image/vnd.microsoft.icon
- text/x-js
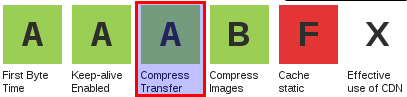
The my site previously had a good result for compression in the Webpagetest.

Web Browser cache (Cache-Control)
Cache-Control is a of most important HTTP header because it says to web browsers what they can do local cache or not. The most web develop frameworks provides a good management under Cache-Contol, they add the HTTP header automatically for images, javascripts, css and webfonts.
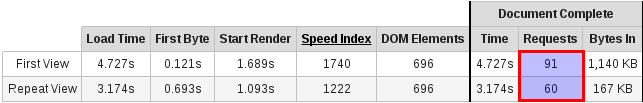
I didn’t my TLS homework this test, because my blog had a lot of third-party content (Linkedin and Slideshare). Unfortunately, they don’t use Cache-Control correctly, and this does the Repeat View isn’t good to. The Repeat View could have 40% less HTTP requests.
Repeat View
Repeat View is the second visit of user to site. E.g.: Every day I read the The Wikipedia home page to read new articles or updates.
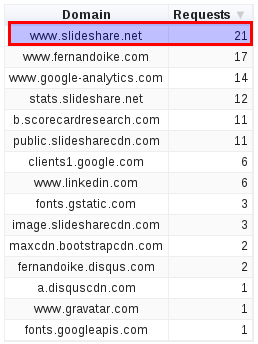
Third-party
Here is the most difficult to gain performance, you don’t have control of Third-party content. My website doesn’t have commercial goals, so readers of my website can be patient but users sites like ecommerces, news portal, etc. want to consume as soon as possible. As you read above, Slideshare as Third-party for my site is worst because they don’t use Cache-Control header.
There are many tricks to improve performance site for Third-party HTTP requests like defer, asynchronous HTTP requests, etc. Often have your mindset, performance and User eXperience are the most important for yours users.